Toll Free: 800-613-6803
Email: water@tramfloc.com
< Previous Page ...... Next Page >
|
|
wastewater flow was
maintained at 3800 m3/d (1 mgd) to each process treatment train
to maintain normal operations. In addition, the following items
were recorded: During mechanical startup testing, the project team noted that white foam developed where the flow dis- charged into the ballasted flocculation basin’s effluent weir troughs and into a common effluent flume before discharging to the excess-flow chlorine contact basin. At the troughs, the flow falls about 4.3 m (14 ft). Foam was also noticed at the discharge of the excess-flow chlorine contact basin effluent box, where flow falls about 3 m (10 ft). During the first day of optimization and process performance testing, white foam appeared at these two locations after the first hour of operation. Foam also appeared at the plant’s dechlorination structure, where the excess flow facilities’ flow blended with the plant’s effluent flow. Here, the excess flow falls about 3 m (10 ft) before being blended with plant effluent. 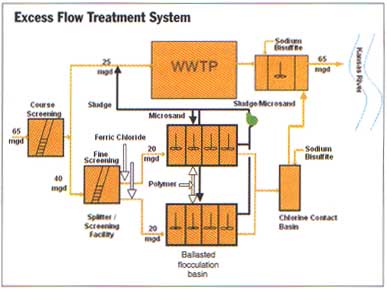
|
|
|
Kansas
River and violations of the plant’s NPDES permit. In the second,
primary basin effluent from the excess-flow storage basin was pumped
and treated by the ballasted flocculation basins. Each basin was operated
for 6 hours at a 23,000-m3/d (6-mgd) flow rate, and microsand pumps
were operated during the entire period. Ferric chloride, polymer,
and microsand were used in the ballasted flocculation basins (polymer
and ferric chloride were dosed at 2 mg/L and 100 mg/L, respectively).
The flow was disinfected with sodium hypochlorite and dechlorinated
with sodium bisulfite in the excess-flow chlorine contact basin. The
flow was then blended with treatment plant effluent and discharged
to the Kansas River. Both testing phases evaluated the following items:
..• influent flow rates for each ballasted flocculation system; ..• operating sequences, normal startup and shutdown, and emergency stopping; ..• operation of each component of the ballasted flocculation system; ..• operation of each treatment train; ..• microsand and solids recirculation pump flow; ..• hydrocyclone underflow rate; and ..• ferric chloride and polymer feed rates. After satisfactory completion of mechanical startup testing, field optimization and process performance test- ing were conducted. Each train was tested during a 6-hour period for 2 consecutive days. During testing, which was similar to the latter part of mechanical checkout, primary basin effluent was stored in the excess-flow storage basin. The project team provided temporary pumping at a 76,000-m3/d (20-mgd) flow rate, and flow was discharged at the excess-flow splitter—screening facility. After fine screening, primary basin effluent flowed by gravity to the ballasted flocculation basin for treatment (polymer and ferric chloride were dosed at 1.5 mg/L and 100 mg/L, respectively). After treatment, flow was disinfected with sodium hypochlorite and dechlorinated with sodium bisulfite. The flow was then blended with the normal plant effluent and discharged to the Kansas River. During the process performance test, |