TRAMFLOC, INC.
Telephone: 480-491-6895 Fax: 480-456-1664
Toll Free: 800-613-6803
water@tramfloc.com
FLUORIDE REMOVAL BY ACTIVATED ALUMINA
Introduction
Fluorides are found in the
waste discharges from process streams in a number of industries. Significant amounts of fluoride come from the
following: glass manufacturers, electroplating operations, steel and aluminum,
pesticides and fertilizer, groundwater and the semiconductor industry. The original fluoride effluent levels can
vary over a large range, and restrictions on final effluent level depend on
place of disposal. When there is any
risk of fluoride seeping back to water supplies, a limitation of about one ppm fluoride is normal.
Apart from treatment of industrial waste streams, the other main
application of fluoride removal is the treatment of municipal water supplies to
reduce the fluoride content to 1 ppm or less.
High levels of fluoride are
generally reduced by precipitation of CaF2 with lime. However, the solubility of CaF2 is
such that ~8 ppm fluoride remains in distilled water,
and in industrial water, residual fluoride can be considerably higher. Since pollution control boards are requiring
effluent limits of 1 ppm fluoride in many cases,
these saturated CaF2 solutions must undergo further treatment.
Reports in the literature
suggest that activated alumina is the best way to reduce fluoride levels down
to below 1 ppm.
If the initial fluoride content exceeds 15 - 20 ppm,
however, a prior treatment with lime to reduce the fluoride and prevent rapid
saturation of the alumina will be economically advantageous.
Several laboratory studies
have been reported. They are all in agreement that fluoride can be removed
below one ppm by adsorption on alumina. Some results are not quantitative, and others
are not in agreement over the amount of fluoride that can be removed, or the best
method of regeneration, etc. A
comprehensive literature review of fluoride removal has been published in
German. A more recent article summarizes
fluoride removal technology; this includes cost estimate data for the use of
alumina, but it is based on laboratory scale work.
A pilot scale operation using
alumina is described by Zolotva and is reported as
operating successfully. While a number
of plant operations are referred to in the literature, most are not described
in detail. An exception is a water
purification plant in
Another benefit of using activated
alumina in water treatment is its arsenic removal capability. Current federal limitation on arsenic in drinking
water is 10 ppb. Such levels are reported
to have been easily achieved using alumina. This paper will focus on the regenerable alumina, although, Tramfloc, Inc. has offered
the disposable grade since 1998.
It is interesting to note the
type of physical properties of the activated alumina are
never discussed in these articles, although they may have a significant effect
upon the fluoride or arsenic removal performance. Other factors likely to have an effect upon
alumina performance are flow rate, other ions in the water to be treated, pH of
the water, and the method and conditions of regeneration.
This bulletin summarizes the
performance of Tramfloc’s Activated Alumina in
removing fluoride from aqueous streams. The variables mentioned above are considered
to some degree, but obviously not all aspects of fluoride from different
streams have been considered. The
information is intended to give a general idea of the fluoride removal
capabilities of alumina. For all but the
simplest systems it is recommended that a small scale test be carried out with
the particular stream to be treated.
Activated Alumina
The granular activated
alumina used in the evaluations discussed in this report is 14 X 28 grind
activated alumina (AA). This is a
transition alumina with a high surface area (>300 m2/g), which
makes it especially suited for adsorption of certain species. It is a fairly high purity alumina with a
pore volume of ~0.5 cc/gm and a bulk density of 46 lbs./ft3. The 14 X 28 S product is a similar activated
alumina but in a spherical form. The
granular alumina has the advantage of being available in smaller sizes, making
the internal active surface of the alumina more readily available. However, the spherical alumina has the
advantage of a lower pressure drop in packed bed (i.e., down flow)
systems. The fluoride removal data
described were obtained with laboratory scale experiments using 14 x 28 mesh
size granular alumina in a packed column.
Pretreatment of
Activated Alumina
The efficiency of the
activated alumina for adsorbing fluoride is generally poor on the first
adsorption cycle unless the alumina is pretreated. A pretreatment which
involves allowing a dilute aluminum sulfate solution (~29 g Al2 (SO4)3
•18 H2O per liter) to remain in contrast with the alumina for
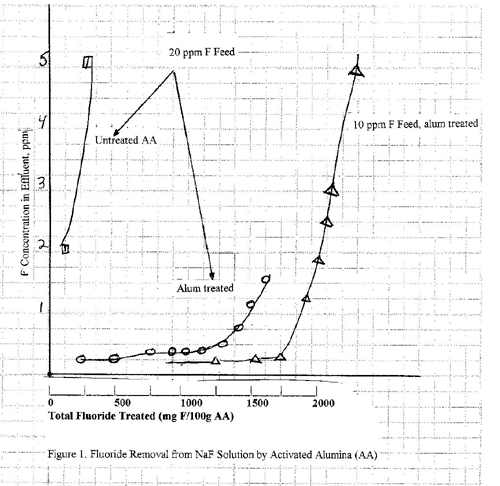
1 hour is found to be particularly satisfactory. The dramatic improvement of treated over
untreated alumina is illustrated in Figures 1 and 2. This pretreatment is very important if the
alumina is being used on a once-through basis or where good performance is
necessary on the first cycle. In a
cyclic system the regeneration procedures described later will activate the
surface for subsequent adsorption cycles.
Fluoride Removal From Neutral Solutions
The effectiveness of alumina
in removing fluoride from aqueous NaF is shown in
Figure 1. Curves are given for initial fluoride concentrations of 10 and 20 ppm. The fluoride
level is readily reduced to ~0.2 ppm in both
cases. The fluoride capacity of the
alumina is slightly greater for the 10 ppm level, but
in both cases it is around 1.5%. These
data are for alumina pretreated with aluminum sulfate; note the poor
performance of the untreated alumina.
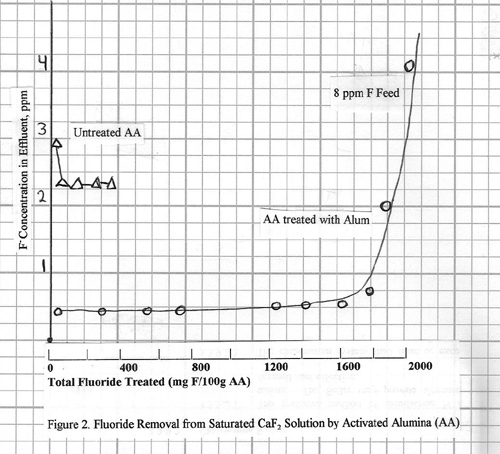
Fluoride removal from a
saturated calcium fluoride solution is shown in Figure 2. This calcium fluoride solution is of special
interest because it is typical of the residual after removing high levels of
fluoride by precipitation with lime.
This feed solution was made up by dissolving excess calcium fluoride in deionized water; the fluoride level was ~8 ppm. The fluoride in
the effluent after passing through the alumina column was 0.2 ppm or less, and the capacity of the alumina was about
1.5%. Again note the poor performance of
the alumina which was not pretreated with aluminum sulfate.
Fluoride Removal From Acidic Solutions
Two solutions containing
hydrofluoric acid in deionized water were used to
evaluate fluoride removal at lower pH.
One contained 9 ppm fluoride (pH 3.63) and the
other 25 ppm fluoride (pH 3.35). The fluoride removal curves are shown in
Figure 3. The fluoride in the effluent
was less than 0.2 ppm, and the capacity of the
alumina at 2.0% was higher than for the neutral solutions. For these tests, the alumina was not
pretreated, hence, the higher fluoride in the effluent (up to 1.8 ppm) during the initial period of adsorption, Figure
3. However, this rapidly changed and the
fluoride level dropped. If this initial
small amount of fluoride passing through cannot be tolerated, then the alumina
should be pretreated even for acidic systems
Effect of Flow Rate
on Fluoride Removal Efficiency
For bed design purposes, the
most important relationship is that between the efficiency and the flow
rate. The data presented so far were
measured at a flow rate of 6 bed volumes per hour, which is slow enough to
enable the full bed capacity to be utilized.
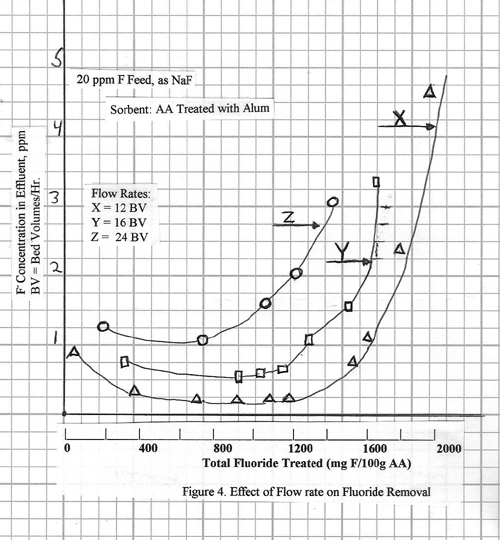
The efficiency of fluoride removal from a 20 ppm
neutral solution at several higher flow rates is shown in Figure 4. At 12 bed volumes per hour, fluoride removal
to ~0.2 ppm is still achieved and the capacity is
similar to that at 6 bed volumes per hour.
At 16.4 bed volumes per hour, some efficiency is lost; the fluoride in
the effluent ranges from 0.5 to 0.8 ppm and the
alumina capacity at 1.0 ppm fluoride breakthrough is
1.3%. At 24 bed volumes per hour the fluoride level falls in the range 1.0 to
1.5 ppm, and the alumina capacity is about 1.0% at
the 1.5 ppm fluoride level.
These flow rate data are for
14 x 28 mesh alumina. It was noted that
if the flow was stopped for several hours, subsequent to breakthrough, then
restarted again, an improvement in fluoride removal occurred. This phenomenon has also been reported in the
literature and suggests diffusion rate limitations.
Therefore, it follows that
flow rate efficiency is affected by particle size. The smaller the particle size, the higher the
flow rate that can be used, but this must be balanced against the higher
pressure drop which results from smaller size material.
Interference From Other Ions
The data shown up to this
point represent single component systems.
In practice, many aqueous streams to be treated will contain other
components. These other components could
have an effect on the fluoride removal efficiency. Therefore, any particular stream should
actually be tested with alumina. Some
data are shown here to indicate the effect some frequently-encountered ions can
have on the adsorption efficiency.
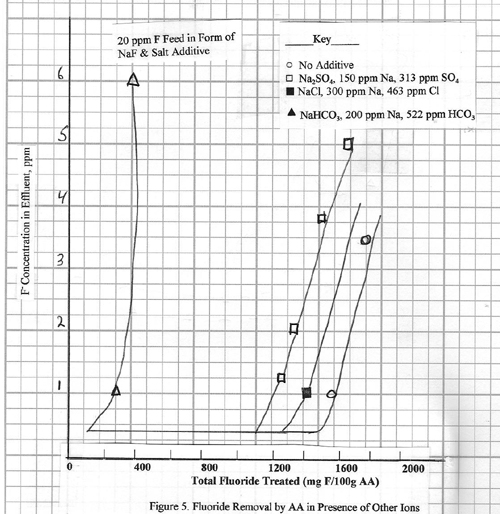
In Figure 5 the fluoride
removal efficiency is shown for a 10 ppm fluoride
solution containing much larger amounts of sodium and one of the following
three anions: chloride, sulfate, bicarbonate.
In all cases the fluoride effluent level is reduced to 0.2 ppm or less, but there are differences in alumina capacity
for fluoride removal. The effects of
chloride and sulfate are very small, but the bicarbonate causes a major decline
in capacity. For the feed solution containing 522 ppm
bicarbonate, the capacity declines to 0.30%, compared to 1.2 to 1.45% for the
other streams. Clearly the bicarbonate
ion has a larger inhibiting effect; presumably competitive adsorption is
occurring.
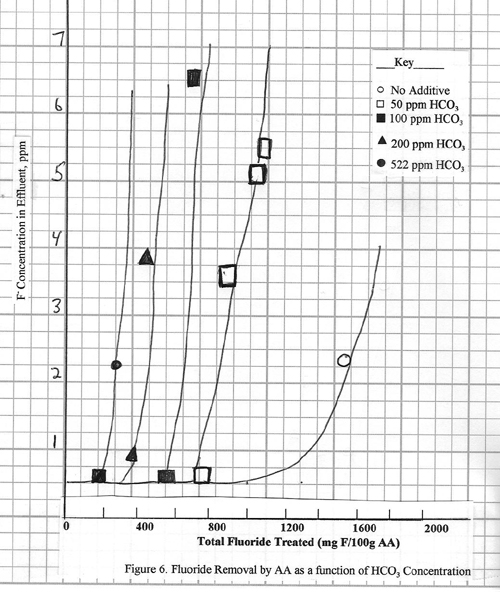
Effects of
Bicarbonate at Various Concentrations
The presence of bicarbonate
at the 500 ppm level reduces the fluoride adsorption
capacity of the alumina by 75 to 80%. In
practice, bicarbonate exists in raw water streams at a variety of levels. The relative effect of different bicarbonate
levels is shown in Figure 6. The curves
show fluoride removal for 10 ppm feed solutions made
from sodium fluoride plus 50, 100, 200, and 522 ppm
bicarbonates. In all cases the fluoride
is always reduced to less than 0.2 ppm, but the total
adsorption capacity of the alumina is considerably reduced. Even for 50 ppm
bicarbonate, the capacity is only 0.75%, which is about half that for the same
solution without any bicarbonate.
Higher levels of bicarbonate
continue to depress the adsorption capacity, but the incremental effect is
less.
The above data indicate that
special consideration has to be given to designing a system for fluoride
removal in the presence of bicarbonate.
Either the bicarbonate has to be removed first, or the system has to be
designed for much lower fluoride capacities.
This subject is also discussed further in the section on regeneration.
Regeneration Methods
Most fluoride removal
applications are long term and necessitate regeneration of the alumina. There are three known methods for regeneration:
(1) NaOH/H2SO4, (2) Al2 (SO4)3
and (3) H2SO4. The
conditions for some laboratory tests on regeneration of A-2 are summarized in
Table I. The effectiveness of the
different regenerations is judged by their subsequent adsorption performance as
shown in Figures 7-10. The letters A-H
shown on the curves identify the regeneration conditions given in Table I. Note that the intention here is to present a
range of regeneration conditions, and none of them should be taken as
necessarily being the optimum.
Table I. Regeneration Data for Activated Alumina
Type F Solution Regenerant Total Volume Time
(ml)/100g A12 O3
________________________________________________________________________
A NaF (1) 1% NaOH 1000 100
minutes
(2) H2O 760 80 minutes
(3) 0.05N H2SO4 1000 100 minutes
________________________________________________________________________
B NaF (1) 1%NaOH 1400 180 minutes
(2) H2O 2000 80 minutes
(3) 0.05N H2SO4 1000 90 minutes
________________________________________________________________________
C NaF 2%Al2(SO4)3
•18 H2O 1290 6.5 hours
________________________________________________________________________
D NaF 2%Al2(SO4)3
•18 H2O 1090 5.25 hours
________________________________________________________________________
•18 H2O 2650 24 hours
________________________________________________________________________
F NaF 2% Al2(SO4)3
•18H2O 8000 5 hours
________________________________________________________________________
G CaF2 2% Al2(SO4)3
•18 H2O 1260 5.75 hours
________________________________________________________________________
H NaF 2% H2SO4 8000 5 hours
________________________________________________________________________
The NaOH/H2SO4
method has been well proven in large scale operation at potable municipal water
treatment plants across the country.
Also the laboratory data shown here indicate that it is the most
effective method.
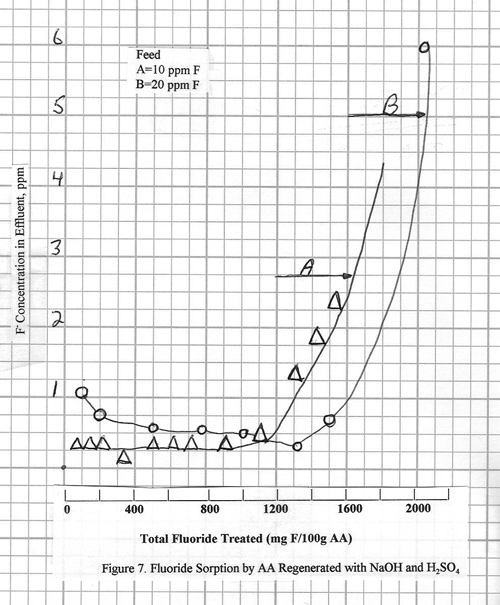
The fluoride removal
performance of A-2 after regeneration with 1% NaOH/H2O rinse/0.05N H2SO4
is shown is figure 7. The curves are for
10 ppm and 20 ppm fluoride
streams made up from NaF. Note that the regeneration procedure for B
takes longer time and uses more NaOH than A. It results in a slightly higher adsorption
capacity for the alumina. The 1% NaOH strips the fluoride off the alumina, than the 0.05 H2SO4
neutralizes residual caustic left after the rinse
step and also reactivates the alumina.
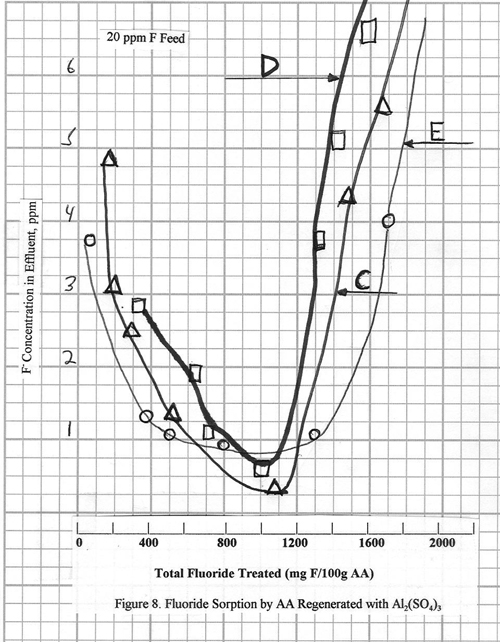
The use of aluminum sulfate
as a regenerant is described in the literature for
laboratory scale testing. The fluoride
adsorption performance of alumina after regeneration with 2% Al2(SO4)3
•18 H2O is shown in Figures 8, 9, and 10. In Figure 8, note that after startup the
fluoride effluent levels are slow in approaching ~1 ppm
and do not fall below this 1 ppm level. The fluoride capacity of the alumina is also
lower in the initial cycle for C and D, but in E, where more aluminum sulfate
solution and longer times are used, the original capacity of the alumina is
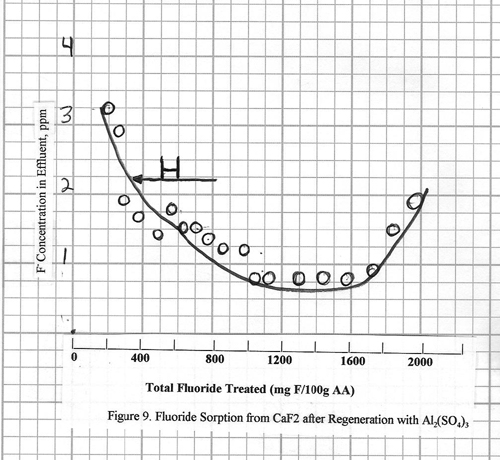
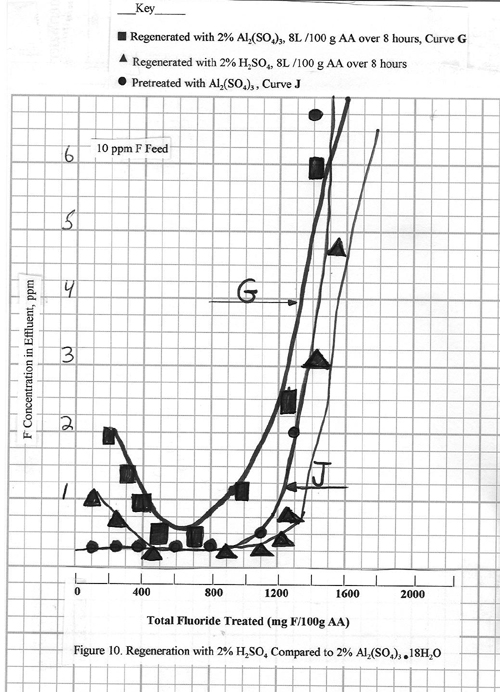
restored. Figure 10 (Curve G) shows a
case where considerably more aluminum sulfate (8.0L/100 g alumina) is
used. The regeneration is much more
effective, with fluoride effluent levels of 0.2 ppm
being achieved. Note that, even so, the
effluent level is slow coming down to this 0.2 ppm
level, and also the alumina capacity is slightly less than for the original
adsorption step.
A case with 2% H2SO4
is also shown in figure 10. The use of
2% H2SO4 is mentioned in the literature. For the example in Figure 10, 8L 2% H2SO4/100
g alumina is used more than 5 hours i.e., the same conditions as for the
aluminum sulfate regeneration in this same figure. The regeneration efficiencies are essentially
the same. However, the use of 2% H2SO4
for regeneration is not recommended because it can have a harmful effect upon
the physical strength of the alumina over a period of time.
EXAMPLE OF TREATMENT OF
A GROUND WATER
A water source containing 10 ppm fluoride required treatment to reduce the fluoride to
<1 ppm.
This particular example illustrates the treatment of water containing
significant amounts of bicarbonate. The
chemical analysis of the water is given in Table II.
Table II. Raw
Water Analysis
PPM
PPM
F 10.0 Fe 0.06
Cl 182 As 0.12
SO4
21 Na
150
PO4 <.02 Ca 135
HCO3 170 Mg 0.35
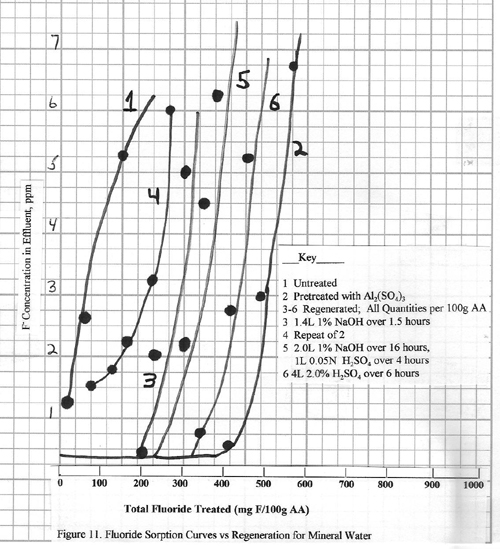
The results of treating this
water with alumina are shown in Figure 11.
First note that very little fluoride removal is achieved with untreated
alumina (Curve 1). The alumina pretreated
with aluminum sulfate reduces the fluoride to <0.2 ppm
and has a capacity of 0.46 g F/100 g alumina (Curve 2). This is about the capacity for a bicarbonate
concentration of 170 ppm based upon the data in
Figure 6. The remaining curves are all
obtained after successful regenerations of this same alumina column. Curve 3 shows the adsorption after
regenerating with 1.4L 1% NaOH/100 g alumina more than 90 minutes, rinse, then 1L 0.05N H2SO4/100 g
alumina. There is a dramatic reduction
in total capacity for this cycle. (0.22 g fluoride/100 g
alumina) although fluoride is reduced to the 0.2 ppm.

![]()
![]()
Last updated
Copyright ©1997-2013 Tramfloc,
Inc. All Rights Reserved.